Have you ever stumbled across a series of ominous-sounding trading terms that sound more like a horror movie than financial jargon? In the world of stock trading, few patterns have a name as foreboding as the “Three Black Crows.” Despite its sinister name, this candlestick pattern is a straightforward and potent tool used by traders to predict a potential downturn in the market. Let’s unravel this mystery together, shall we?

What Exactly Are the Three Black Crows?
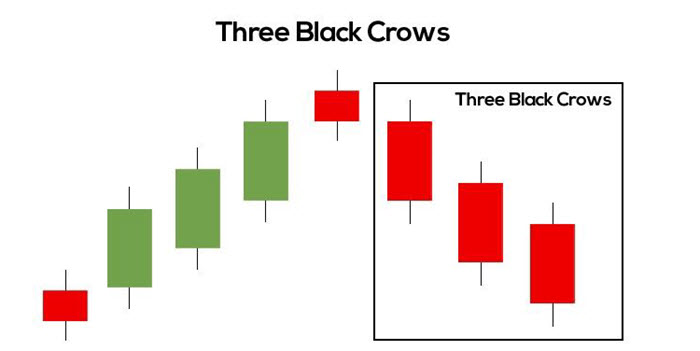
The Three Black Crows is a bearish candlestick pattern commonly used in technical analysis. The pattern consists of three consecutive long-bodied candlesticks that open within the body of the previous candle and close lower than the previous day. These candlesticks are all black or red, depending on the color convention of the chart, indicating a decline.
Formation and Interpretation
To spot this pattern, you should look for the following criteria on a daily chart:
- A prevailing uptrend: The Three Black Crows pattern typically forms at the peak of an uptrend, signaling that the current trend could be losing its wings.
- Three bearish candles: Each candle should open at or near the close of the previous candle, and close progressively lower. This indicates a strong selling pressure and a shift from bullish to bearish sentiment.
- Consistent bear size: The bodies of the candles should be roughly the same size, which shows sustained selling interest over three consecutive sessions.
When traders spot this pattern, it’s often taken as a clear signal that the bullish days are numbered and a bearish trend might just be on the horizon. But why does this pattern matter?
Why the Three Black Crows Matter
Imagine you’re a birdwatcher, looking for patterns in nature to predict what will happen next. In trading, patterns like the Three Black Crows help traders anticipate potential market movements based on past behaviors. This pattern is particularly significant because it suggests a strong and sudden shift in market sentiment. This isn’t just a fluke; it’s a deliberate movement by bearish traders pushing the price down over three sessions, showing a robust and sustained effort to reverse the trend.
Trading Strategy Involving the Three Black Crows
So, how do traders use this spooky-sounding pattern to their advantage? Here’s a simple strategy:
- Confirmation is key: Always wait for additional confirmation before deciding on your next move. This could be in the form of a lower open or close on the fourth day following the pattern.
- Set stop-loss orders: To manage risk effectively, set a stop-loss order above the highest of the three crows. This protects you from potential losses if the pattern doesn’t predict the trend reversal accurately.
- Monitor closely: After entering a trade based on this pattern, keep a close eye on market behavior. If prices start to rise, it might be time to reconsider your position.
Considerations and Limitations
While the Three Black Crows pattern can be a powerful indicator, it’s not foolproof. It’s essential to consider the context in which this pattern forms:
- Market conditions: Other market dynamics, such as economic announcements or changes in interest rates, can influence the effectiveness of this pattern.
- Volume data: Ideally, the formation of the Three Black Crows should be accompanied by increasing volume, which validates the pattern with more significant selling pressure.
Real-Life Example
Let’s look at a practical example. During a strong uptrend, a stock shows significant growth. Suddenly, three long, red candles form, each closing lower than the last, all appearing on high volume days. This might be your cue to think about securing any profits and preparing for a potential trend reversal.
Conclusion
The Three Black Crows pattern isn’t just a harbinger of doom; it’s a useful tool for traders aiming to gauge market sentiment and make informed decisions. Like all indicators, it’s most effective when combined with other technical analysis tools and market knowledge. By mastering patterns like these, you can enhance your trading strategy, manage risks better, and potentially increase your profitability.
Now, wouldn’t you agree that understanding these patterns makes you feel like you have a secret map that guides you through the treacherous waters of stock / forex trading?
All the information made available here is generally provided to serve as an example only, without obligation and without specific recommendations for action. It does not constitute and cannot replace investment advice. We, therefore, recommend that you contact your personal financial advisor before carrying out specific transactions and investments.
In view of the high risks, you should only carry out such transactions if you understand the nature of the contracts (and contractual relationships) you are entering into and if you are able to fully assess the extent of your risk potential. Trading with futures, options, forex, CFDs, stocks, cryptocurrencies and similar financial instruments is not suitable for many people. You should carefully consider whether trading is appropriate for you based on your experience, your objectives, your financial situation and other relevant circumstances.
